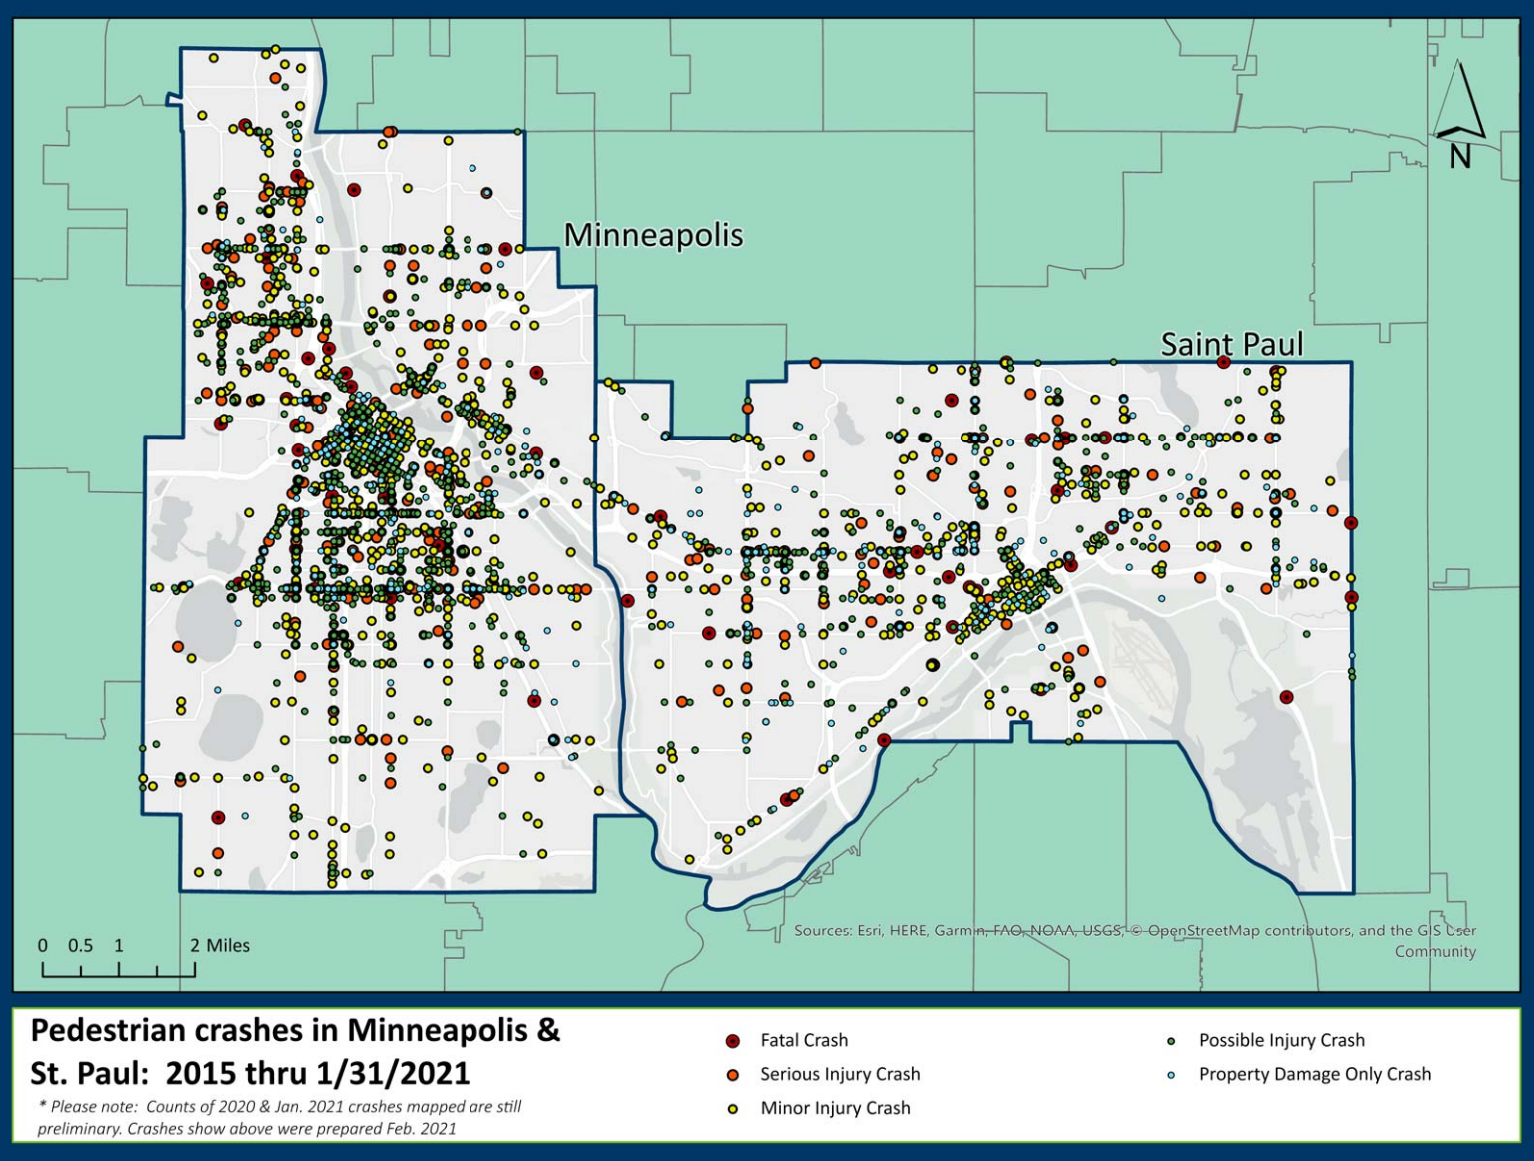
Since 2016 there have been a total of 2,598 reported crashes involving pedestrians in the Twin Cities alone. That comes out to nearly one and a half crashes per day. Crashes have been scattered across the twin cities with a higher density of crashes located in downtown areas, with 1,776 crashes occurring in Minneapolis and 866 occurring in Saint Paul. These crashes involve all types of pedestrians and can happen at any time of the day under a wide range of conditions; however, it's important to know under what circumstances most of these crashes have occurred to raise awareness.
|
Age |
Pedestrians Involved In Crashes |
|
1 - 9 |
157 |
|
10 - 19 |
337 |
|
20 - 29 |
577 |
|
30 - 39 |
571 |
|
40 - 49 |
309 |
|
50 - 59 |
345 |
|
60 - 64 |
125 |
|
65+ |
208 |
|
Sex |
Pedestrians Involved In Crashes |
|
Male |
1394 |
|
Female |
1168 |
|
Crash Severity |
Pedestrians Involved In Crashes |
|
Property Damage Only Crash |
336 |
|
Possible Injury Crash |
900 |
|
Minor Injury Crash |
1039 |
|
Serious Injury Crash |
318 |
|
Fatal Crash |
49 |
|
Time of Day |
Pedestrians Involved In Crashes |
|
Sunrise |
45 |
|
Daylight |
1479 |
|
Sunset |
89 |
|
Dark (No Street Lights) |
24 |
|
Dark (Lights Off) |
7 |
|
Dark (Lights On) |
928 |
|
Dark (Unknown Lighting) |
25 |
|
Other |
10 |
|
Unknown |
35 |
|
Weather |
Pedestrians Involved In Crashes |
|
Dry |
1889 |
|
Wet |
476 |
|
Snow |
87 |
|
Ice/Frost |
60 |
|
Slush |
25 |
|
Unknown |
90 |
|
Other |
6 |